
Something Has to Give.
By Wolf Richter for WOLF STREET.
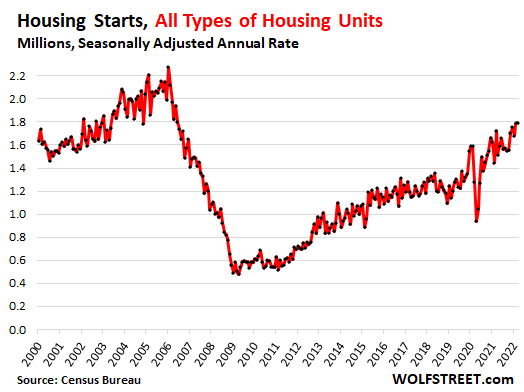
Builders started construction on 147,400 privately owned housing units of all types in March, the biggest March since 2006. Housing starts are very seasonal and peak in the summer. This included:
- 99,100 single-family houses, which was below March 2021 (102,800 houses), but both were the biggest March housing starts since 2007.
- 46,700 units in buildings with 5+ units, such as rental apartments and condos. This was the biggest month – any month, not just March – since 1986, as the boom in multifamily building construction continues, unperturbed by rumors of some kind of urban exodus.
In terms of the seasonally adjusted annual rate, builders started construction at a rate of 1.79 million housing units of all types in March, the highest of any month since June 2006.
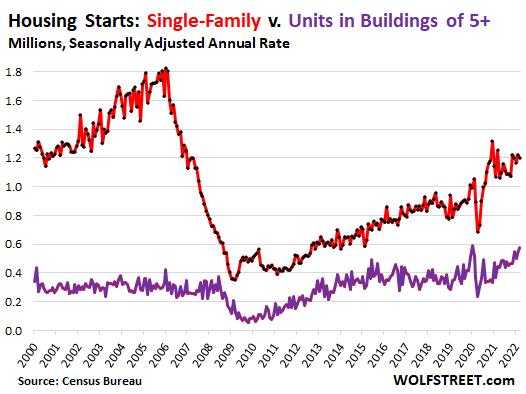
Single family houses v. units in multifamily buildings.
Construction starts of single-family houses, in terms of the seasonally adjusted annual rate, dipped from February to 1.20 million in March, in the same relatively high range that has prevailed since late 2020 and measures up there with 2007 (red line in the chart below).
Construction starts of units in buildings with five or more units, rose to a seasonally adjusted annual rate of 574,000 units. This and the spike in January 2020 were the biggest multifamily housing starts since 1986 (purple line):
Construction and the industries that it supports are important parts of the US economy. A downturn in the construction industry can substantially contribute to an overall economic recession.
Before the Great Recession, housing starts peaked in 2005, after years of overbuilding, and then went into a long downturn. The Great Recession didn’t start until December 2007, by which time housing starts had plunged. Housing starts bottomed out in early 2009 and stayed in the dumpster for two more years before beginning to recover.
Now, housing starts are booming, and there are no signs of a construction slowdown, beyond the issues foisted on the industry by shortages of materials and labor that cause construction projects to be delayed.
The “Housing Shortage?”
On a theoretical level, let’s compare the annual rate of housing starts to the annual rate of the increase in the number of households. This isn’t 100% on target because housing starts alone don’t include the (relatively small number of) housing units being torn down to make room for new housing units. But it serves as a rough indication of the trend over time.
In the chart below, the horizontal purple line marks the average annual increase in the number of households since 2000, according to the annual data from the Census Bureau through 2020, amounting to an average increase of 1.17 million households per year. Annual household growth varies from year to year. In 2020, household growth actually turned negative for the first time in the annual data going back to 1948.
A household is defined by people living in a housing unit (an address), whether a single person or a multi-generation family or a bunch of roommates. As long as they live in the same housing unit, it’s a “household.”
Where the red line – the seasonally adjusted annual rate (SAAR) of housing starts of all types – is above the purple line, housing units were built faster than households were being added on average.
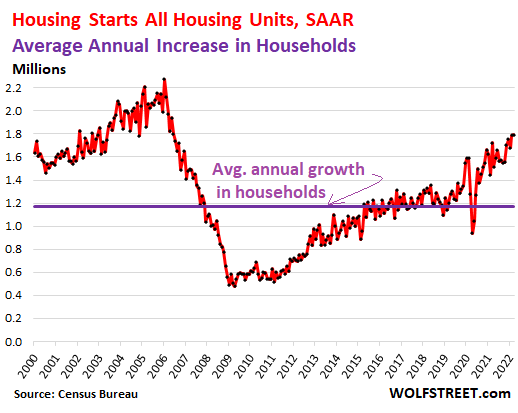
As the chart shows, during the housing construction boom through 2005, there was significant overbuilding, which then contributed to the housing bust.
Even as the housing bust set in and the land was flooded with vacant and newly built housing units, housing starts continued to outrun household growth until 2007, when housing starts had plunged far enough to where for the next few years, there were fewer housing starts than average household growth, and those additional households started absorbing the housing units (buy or rent).
Between 2015 and 2019, housing starts and household growth were roughly in balance. But they’re not in balance now – with far more housing starts than average household growth, particularly in light of the negative household growth in 2020.
The picture of the much cited “housing shortage” is muddled by numerous factors, including the construction boom that is outrunning household growth. Many households have acquired more than one housing unit, where the other units are vacant much or all of the time. This may be a second home or a third home, or a vacation rental, or a home they haven’t sold yet after moving out in order to ride up the market all the way and then sell it (I know a few people who are doing precisely that).
However, when investors buy housing units to then put them on the rental market, there is no impact on the overall “housing shortage.” It’s when someone buys a second home or a vacation home that remains unoccupied most of the time, or is turned into a vacation rental, that a housing unit is removed as a housing unit.
What there is, though, is a shortage of housing units that are priced such that people can actually afford to live in them, rental or purchase, after the massive price increases in recent years, and the rent increases in many cities.
Enjoy reading WOLF STREET and want to support it? Using ad blockers – I totally get why – but want to support the site? You can donate. I appreciate it immensely. Click on the beer and iced-tea mug to find out how:

Would you like to be notified via email when WOLF STREET publishes a new article? Sign up here.
![]()