
You can see why some retailer stocks are not liking the shift from goods back to services.
By Wolf Richter for WOLF STREET.
Americans outspent inflation by a good margin in April. “Real” spending on goods – what consumers buy at retailers, adjusted for inflation – rose for the month but was down from the stimulus-miracle peak last year. “Real” spending on services (such as healthcare, travel, entertainment, etc., adjusted for inflation) jumped, after having collapsed during the pandemic, as the shift in spending from goods back to services continues in a sign that the distorted stimulus-economy is normalizing. Services spending is the biggie, accounting for over 60% of total consumer spending.
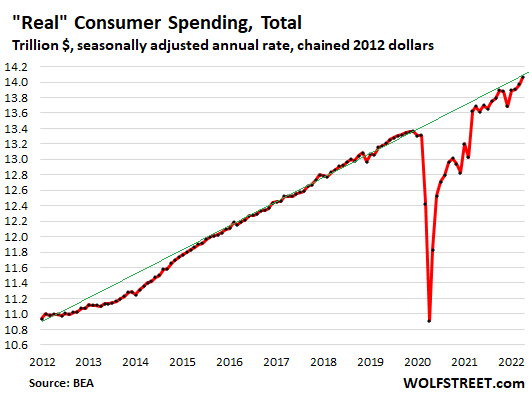
“Real” spending rose, approaching pre-pandemic trend.
Inflation adjusted spending on goods and services jumped 0.7% in April from March, to a new record, and was up 2.8% from stimulus-miracle April last year, according to the Bureau of Economic Analysis today. It is now approaching the pre-pandemic trend, as the consumer economy is normalizing at pre-pandemic growth rates, all adjusted for inflation:
“Real” spending on services jumped, but long way to go.
Inflation-adjusted spending on services – healthcare, housing, education, air fares, lodging, rental cars, entertainment and sports events, haircuts, repairs, etc. – jumped by 0.5% in April from March, and by 5.9% year-over-year.
Real spending on services finally surpassed the levels from before the pandemic and set a new record, after the collapse of spending on discretionary services during the pandemic (such as airfares, discretionary healthcare services, such as dentists and elective surgery, haircuts, etc). It remains far below the pre-pandemic trend (green line), but is on the way to normalizing, as spending shifts from goods back to services.
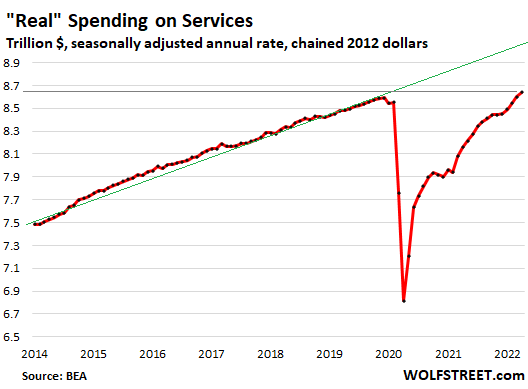
This sharp increase in “real” spending on services in recent months (+5.9% year-over-year) is what has been driving consumer spending, even as spending on goods has fallen from the stimulus-fueled peaks a year ago.
Spending on services matters: In April, it accounted for 61.4% of total consumer spending, but is still down from the pre-pandemic average of over 64%. This is an indication that spending on services, as it normalizes, will continue to grow at a disproportionate pace (so watch out for services CPI inflation, which is starting to eat everyone’s lunch).
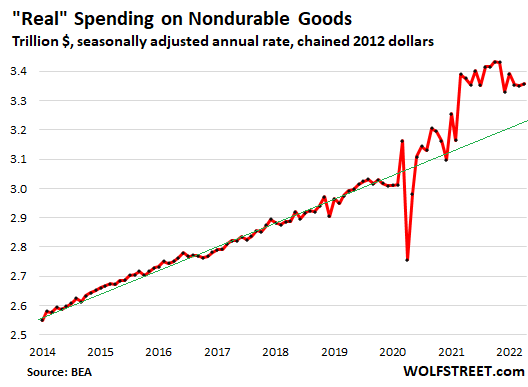
Real spending on nondurable goods slowly normalizing, at nosebleed levels.
Inflation-adjusted spending on nondurable goods – dominated by food, fuel, and household supplies – edged up by 0.2% for the month but was down 0.5% from the stimulus-miracle spike in April a year ago.
Even after the year-over-year decline, consumer spending on nondurable goods remains at nosebleed levels, up by 12% from April 2019, and well above the pre-pandemic trend (green line). But it is on track to gradually normalize and revert to pre-pandemic trend:
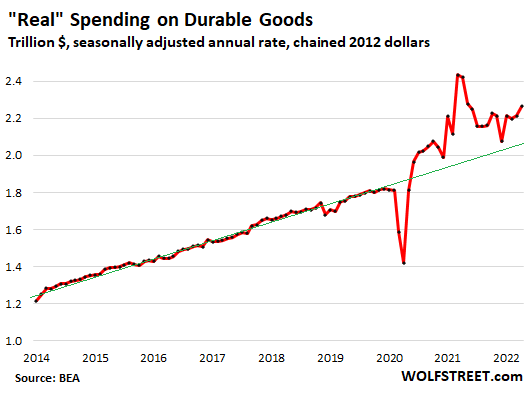
Real spending on durable goods suddenly jumps month-to-month.
So, just to dish up another surprise about the “tapped-out” or whatever American consumers, inflation-adjusted spending on durable goods jumped by 2.3% for the month, just when you thought that consumers had bought all they stuff they needed, and were going to back off.
Compared to the stimulus-miracle spike in April last year, real spending on durables was down 6.5%. Spending remains at nosebleed levels, up 29% from April 2019, and continues to contribute to the shortages and price spikes of some of these goods, and to the massive trade deficit as many of these goods are either made in other countries or contain components that are made in other countries.
But you can see the uneven normalization, the regression toward the pre-pandemic mean:
“Real” income below pre-pandemic trend.
Inflation-adjusted personal income from all sources fell 3.5% from April a year ago, when the stimulus money was still arriving, but ticked up a tad from March (purple). This includes income from wages and salaries, dividends, interest, rentals, farms, businesses, and government transfer payments (stimulus, Social Security, unemployment, welfare, etc.), but does not include capital gains. Late last year, as inflation was surging, real income fell below the pre-pandemic trend and has stayed there. It’s up just 6.0% from April 2019.
Inflation-adjusted income without transfer payments rose by 2.0% from a year ago, and by 0.3% in April from March (red line). It fell below pre-pandemic trend at the beginning of the pandemic. After a partial recovery, it lost more ground since late last year due to the surge in inflation and has remained essentially flat since November.
![]()
“Real” per-capita disposable income looks worse.
The above income data was for aggregate income, for all consumers combined, where income growth is also fueled by rising employment and population growth.
Here is the per-capita level of “real” disposable income – meaning per-person after-tax income from all sources, which was flat for the month and down 6.4% from a year ago, and up just a tiny minuscule 1.8% from April 2019. And it’s deeply below pre-pandemic trends:
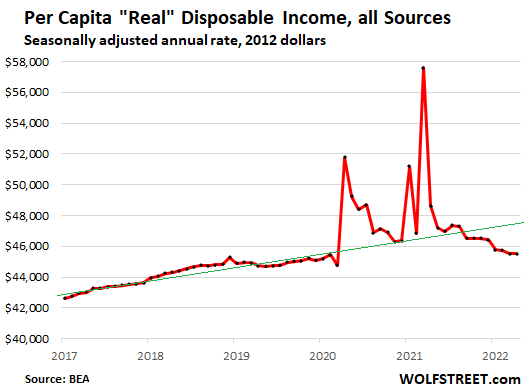
The substantial increase in inflation-adjusted spending and the morose situation of inflation-adjusted income (which does not include capital gains) show that consumers – not all but enough to move the needle – are still flush with money from the gazillion stimulus programs and with money they can extract from the surge in the prices of real estate, stocks, and cryptos, where consumers made in aggregate trillions of dollars, some of which they already spent, and some of which have vanished in recent sell-offs, and some of which they still sit on and will continue to spend.
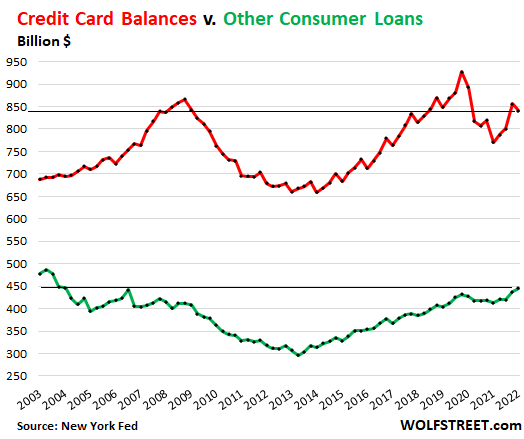
But consumer borrowing to spend, well… not so hot.
Not adjusted for inflation: Credit card balances, excluding other revolving loans such as personal loans, dipped to $840 billion in Q1, from Q4, still below Q1 2020 and Q1 2019, and back where they’d been in Q1 2008, despite 13 years of population growth and 37% CPI inflation (red line).
Other consumer loans, such as personal loans and payday loans, at $450 billion, were also below the highs before the Financial Crisis, despite 13 years of population growth and 37% CPI inflation (green line).
For my detailed discussion of consumer borrowing in all categories, delinquencies, foreclosures, third-party collections, and bankruptcies, read… Consumers Can Handle Fed Tightening: Their Debts, Delinquencies, Foreclosures, Collections, and Bankruptcies
Enjoy reading WOLF STREET and want to support it? Using ad blockers – I totally get why – but want to support the site? You can donate. I appreciate it immensely. Click on the beer and iced-tea mug to find out how:

Would you like to be notified via email when WOLF STREET publishes a new article? Sign up here.
![]()